DC's Expensive, but that's not the Whole Story
August 31, 2016 // originally published by Greater Greater Washington
Earlier this month, a map saying that $100 will buy you less in DC than any other state made the online rounds. But while it's true $100 will buy you less in DC, it's misleading to leave it at that because DC's higher incomes mean it's easier to make $100 here than in many other places.
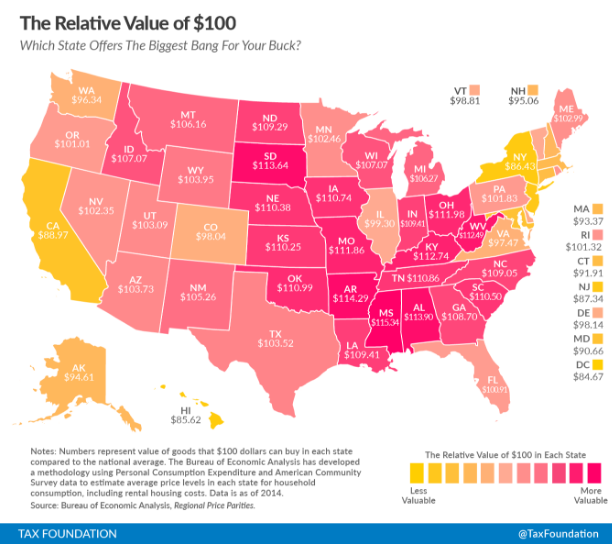
The above map, which came from the Tax Foundation's Alan Cole uses the relative value of $100 across states to highlight how prices of the same goods vary. "The same amount of cash can buy you comparatively more in a low-price state than in a high-price state," writes Cole. For instance, in Mississippi, the state with the lowest prices, you could spend $100 to buy goods that would on average cost $115.34 in the US. Conversely, DC has the lowest relative value of $100: If you spend $100 in DC you would receive goods that on average cost $84.67.
Concluding that DC is the most expensive place in America is a bit disingenuous. States are a mix of urban, surburban and rural. DC is wholly urban, and urban areas tend to be more expensive. A more accurate view would compare DC to other cities. The Tax Foundation did just that a week later with the map below, comparing the relative value of $100 across metro areas.
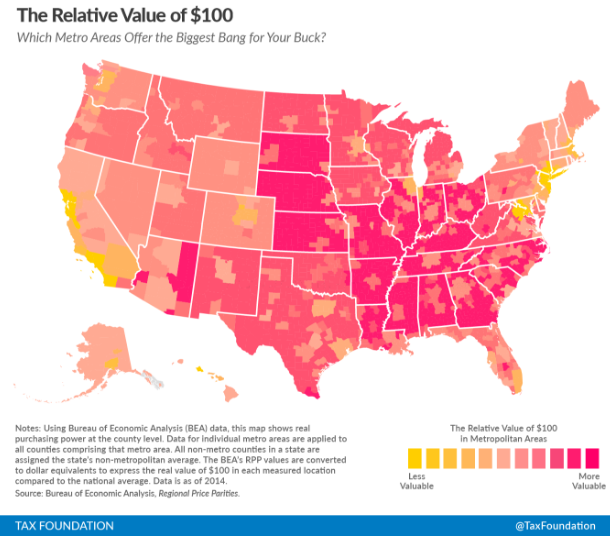
When compared to metro areas, the DC region is the seventh most expensive. But there is an even bigger underlying issue with this analysis: it doesn't take income into account at all. In other words, while $100 might buy you a different amount of goods in one place versus another, varying incomes also mean it's faster to make $100 in some places compared to others.
The map below shows the real personal income for each metro area. This measure adjusts income to account for regional price variations and inflation. Among the 428 metro and non-metro areas, DC has the 23rd highest real personal income. So while the DC region has high prices, it also has high incomes. To some extent, the two balance each other out.
Real Personal Income
Income adjusted for regional price differences and inflation
Created by: DataLensDC, Source: Bureau of Economic Analysis.
Technical notes: Data are available through the Bureau of Economic Analysis. You can find complete code for this on my github page, as well as the Tax Foundation's github page.