DC: The East Coast's Most Migratory City
August 2, 2015
When I moved to DC about five years ago, I did so with an onslaught of millennials in search of jobs and housing that was not their parents (along with a few others who may have had loftier aims). People would often ask 'where are you from?' because it was obviously not DC, and 'when did you move here?' because, inevitably, you just did.
And five years later these questions haven’t actually changed much. Of course, there are a number of people that have lived here for years, but DC is never short of transplants starting anew. The constant influx is one of the things I like about DC; it's a very migratory population. But, really, how migratory?
How Migratory are Major U.S. Cities?
Circle size indicates migration score based on migration rate and migration distance traveled.
Click on a circle for more information
Source: Census American Community Survey (2008-2012 mobility estimates).
In fact, DC is the most migratory city east of the Mississippi and rounds out the top five for most migratory cities:
- 1. San Francisco
- 2. Seattle
- 3. Portland
- 4. Las Vegas
- 5. Washington DC
- 6. Denver
- 7. Phoenix
- 8. Austin
- 9. New York
- 10. Boston
It appears "Go west, young (wo)man!" is far from dead.
This migration score is driven by two factors - how many people move to the city each year as a proportion of the city's population and how far people travel when they move to the city. Looking at these two drivers across these cities four distinct groups became clear -
What does migration look like across cities?
Cities plotted based on migration rate and migration distance traveled.
The quadrants are drawn at the median of each axis.
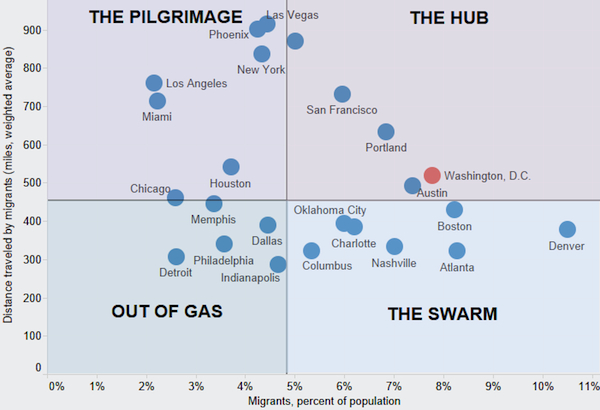
Source: Census American Community Survey (2008-2012 mobility estimates).
What we see above is:
- The Pilgrimage. Not as many migrants come each year compared to city size but they come from far and wide. Whether it’s to make it in LA or New York or live out the rest of their days in Phoenix, these cities lay at the end of The Pilgrimage.
- The Hub. These cities have a large inflow of migrants annnually coming from across the U.S. These cities are not as large as the Pilgramage cities but have a distinct character or lifestyle, like Portland, or job market, like Seattle, that attracts people to The Hub.
- The Swarm. These cities attract a large number of closer migrants. These cities are often emblematic of their larger region whether it's Boston for New Englanders, Atlanta for Southerners or Denver for people of the Mountains.
- Out of Gas. Not too many people descend on these cities, and when they do it’s not from very far. Who’s to say why they come - maybe they ran out of gas on The Pilgrimage, maybe they came through town one night and just couldn’t turn away.
And there sits DC in the Hub. But beyond being a government town what are the distinct characteristics and trends of the city? More on that to come...
Technical notes: Graphics and rankings are based on the Census American Community Survey (ACS) 2008-2012 mobility estimates. The data is at the county-level. In some instances, the county extends beyond the city but there was not sufficient difference to exclude or weight such cases. Average distance travel is calculated using an average weighted by the number of migrants. The quadrants in the scatterplot shown above are defined by the median of each measure. The migratory score used to calculate rankings and circle size is based on the weighted average distance traveled by migrants and the number of migrants proportional to city size. You can find complete code on my github page.